Observable Plotting Tutorial
Basic plotting
For any Palantir Observable, there are some basic ways to plot data.
Throughout this part of the tutorial, we will use a E2EObservable
>>> import palantir.structures as structures

>>> startDate = '231102'
>>> endDate = '231102'
>>> startTime = '000000'
>>> endTime = '100000'

>>> infraID = 1
>>> REFIMEVE = structures.Infrastructure(infraID, startDate, endDate, startTime, endTime, 'UTC')

>>> freq_transfer = REFIMEVE.processE2E(1)
>>> observable = freq_transfer.e2e
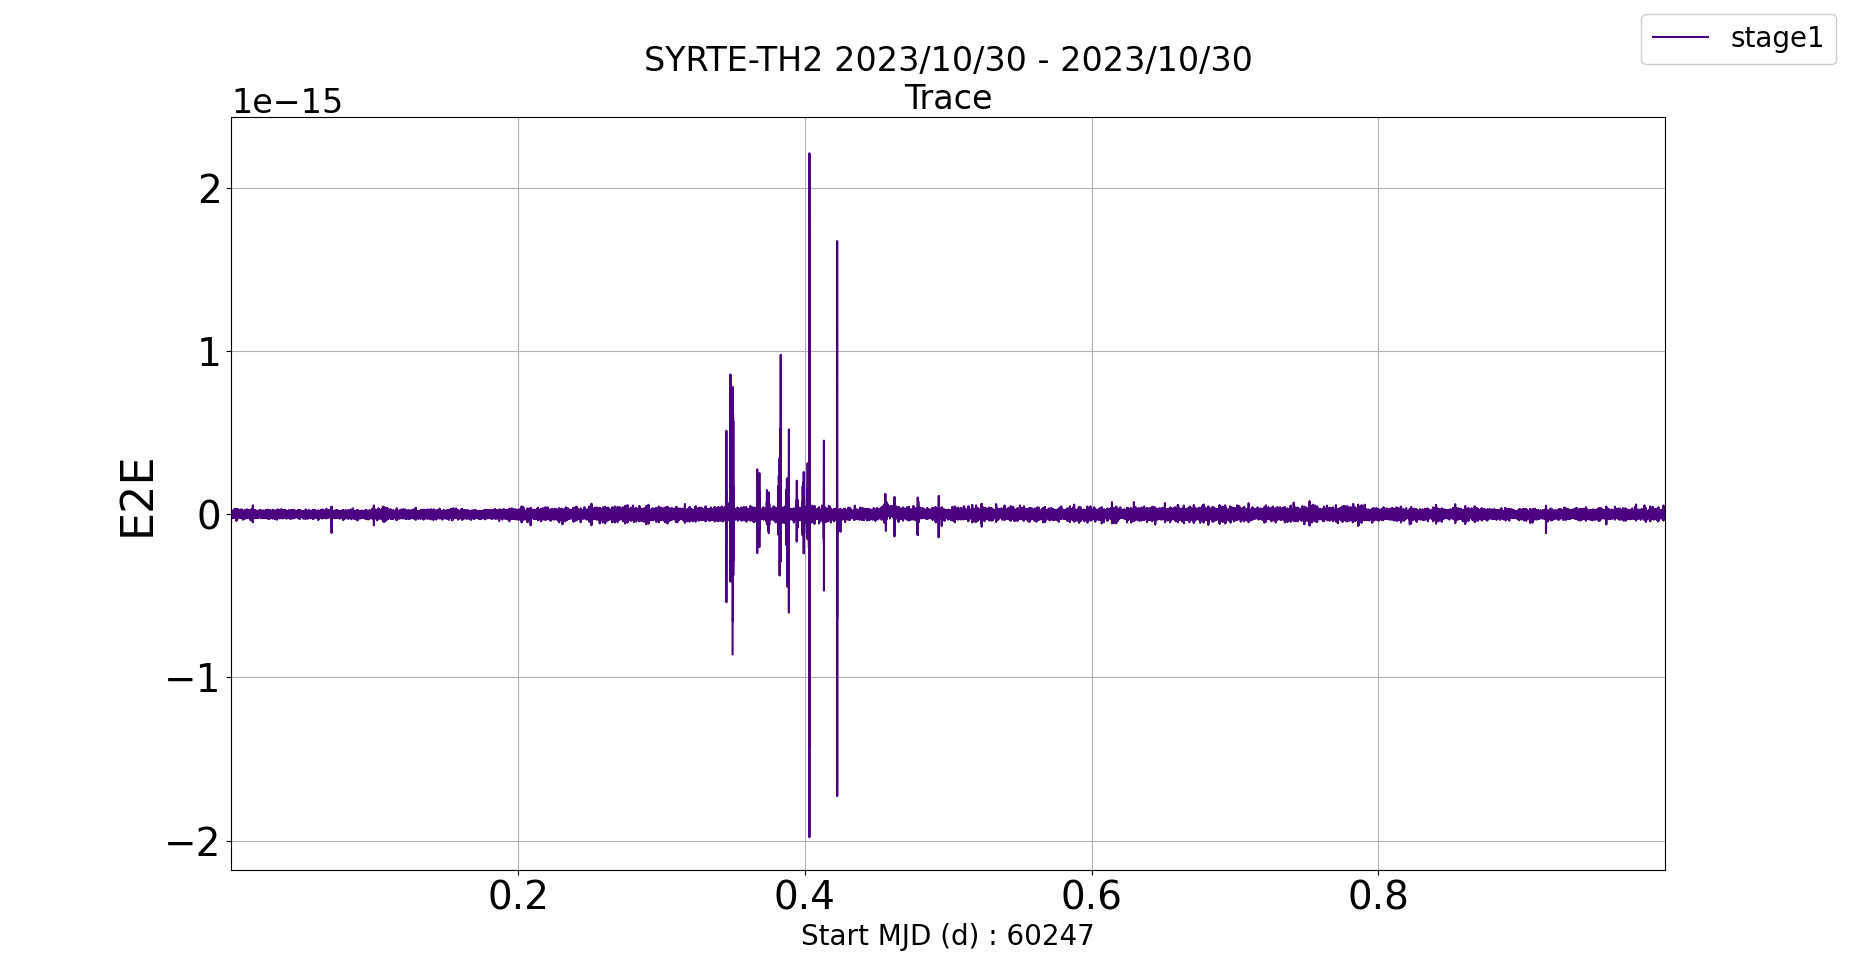
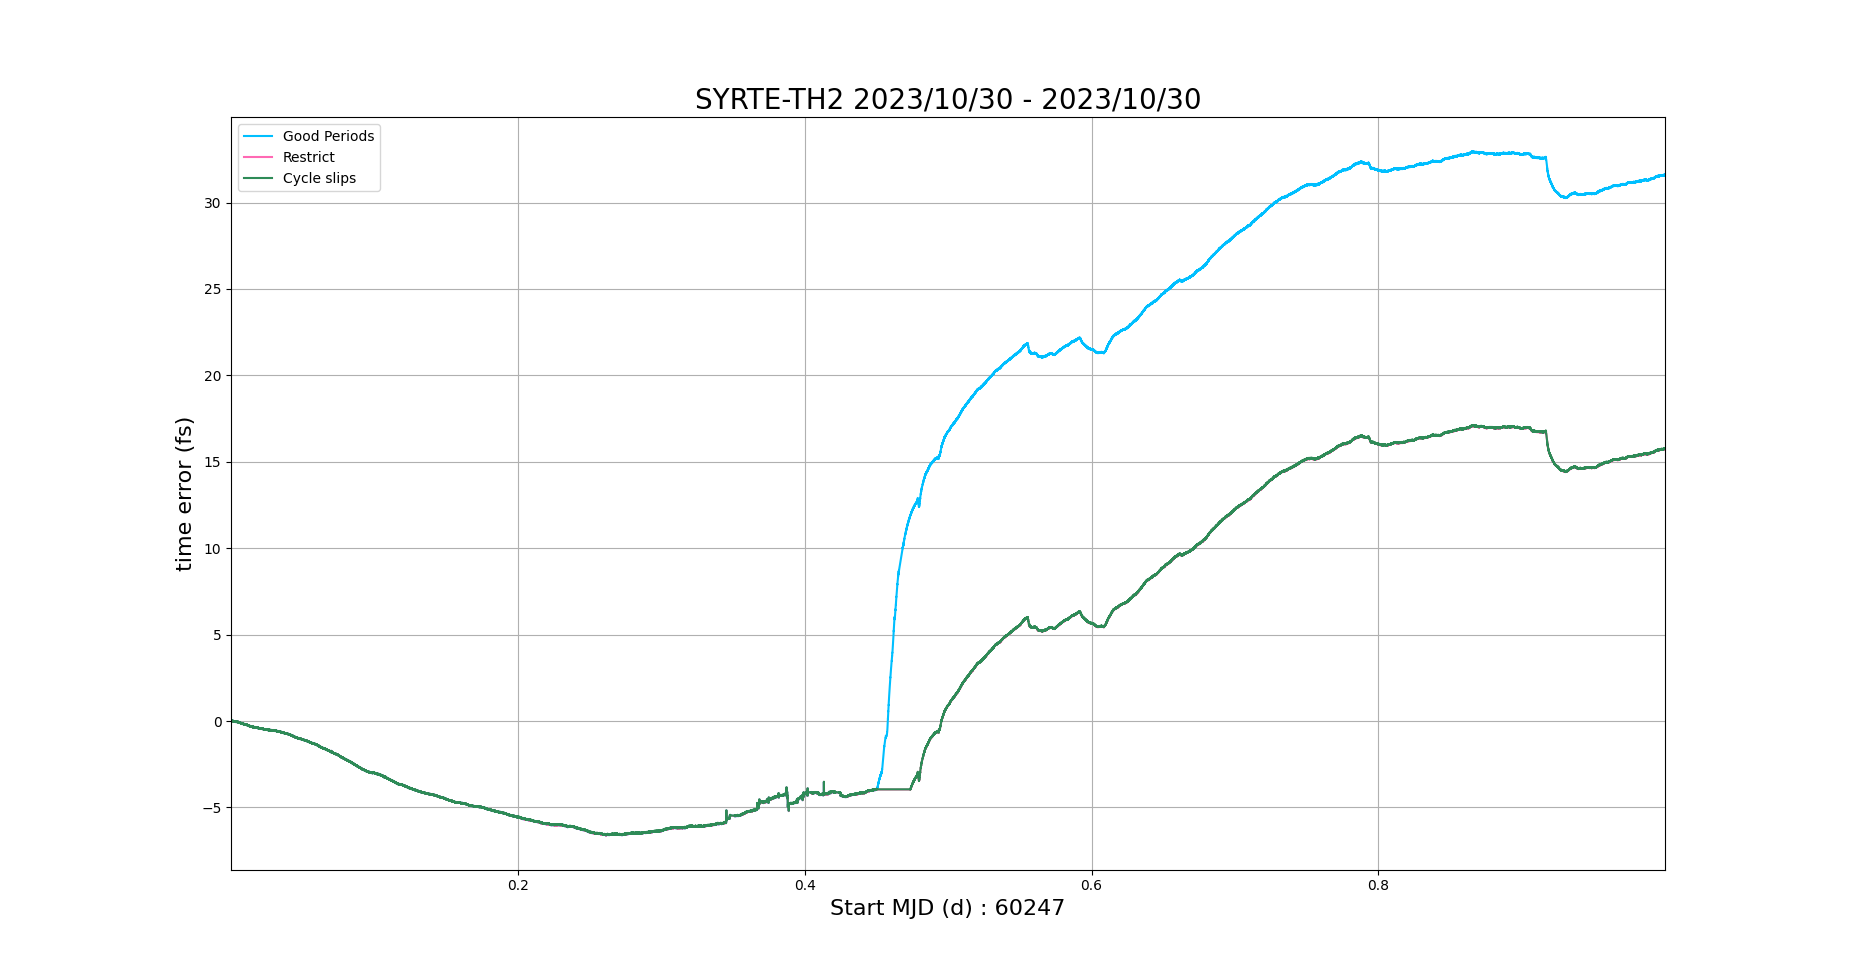
Using the plotTrace()
Trace
>>> observable.plotTrace(stageKey="stage1")
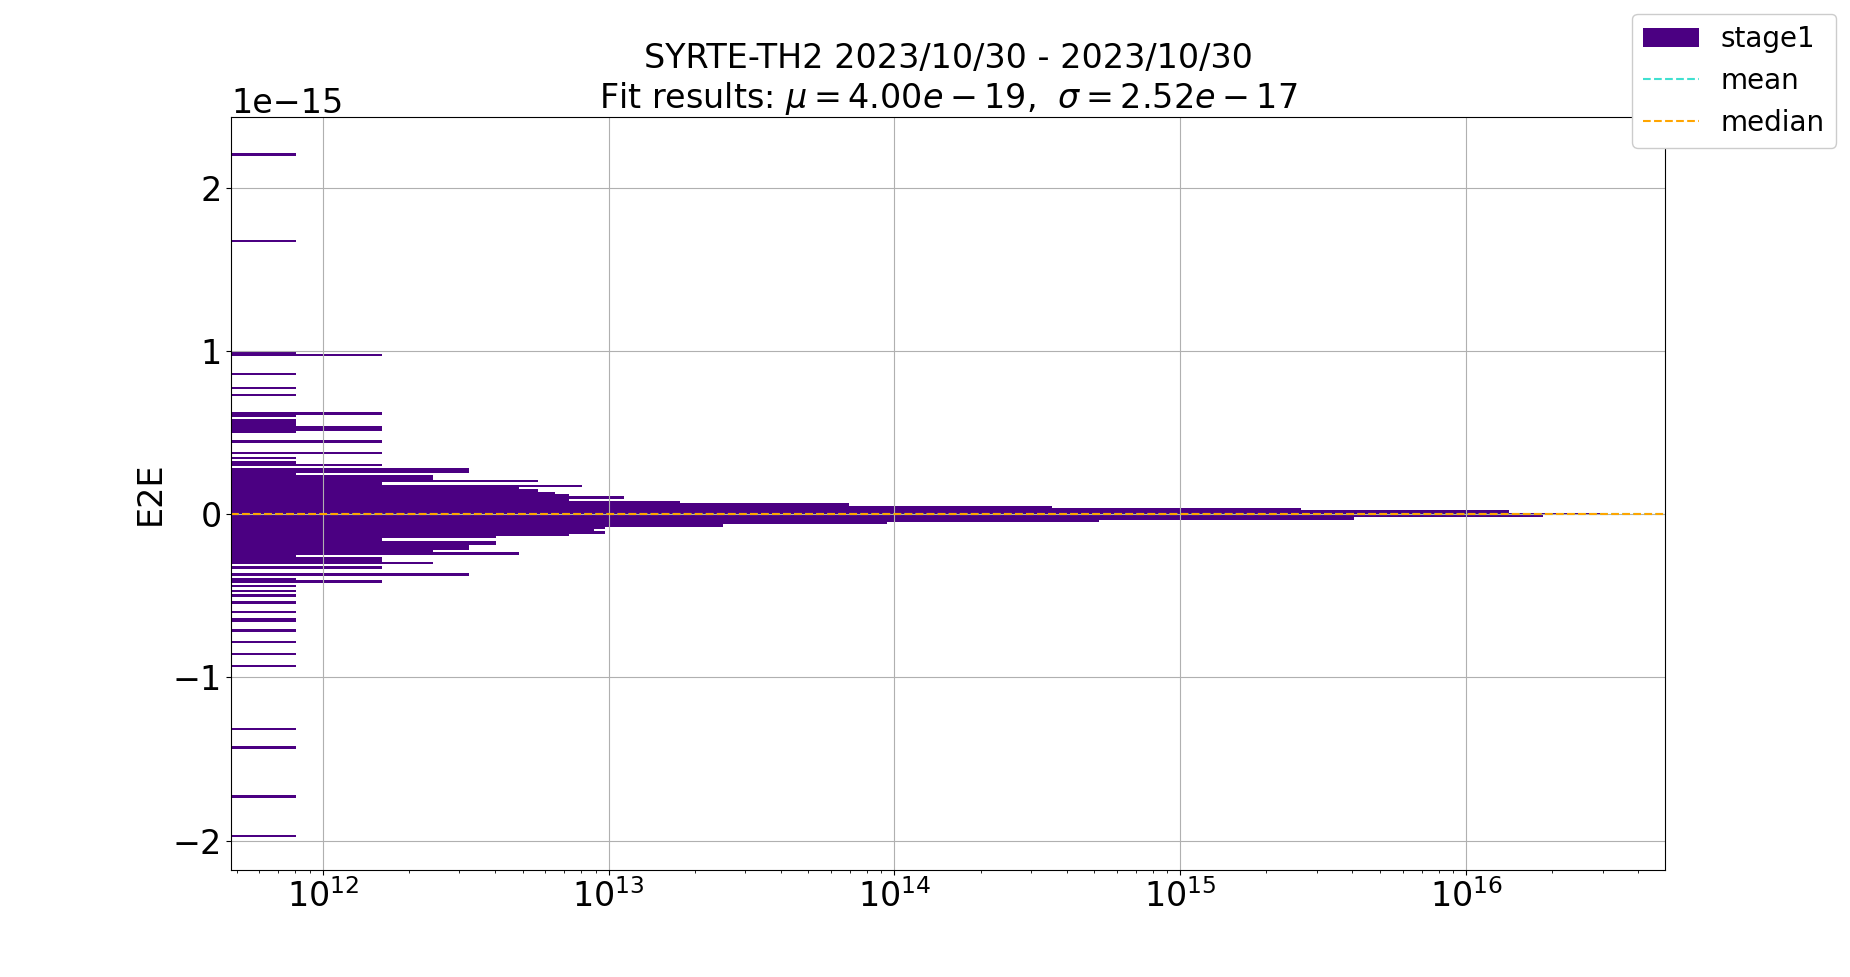
Using the plotDistribution()
Density Distribution
>>> observable.plotDistribution(stageKey="stage1")
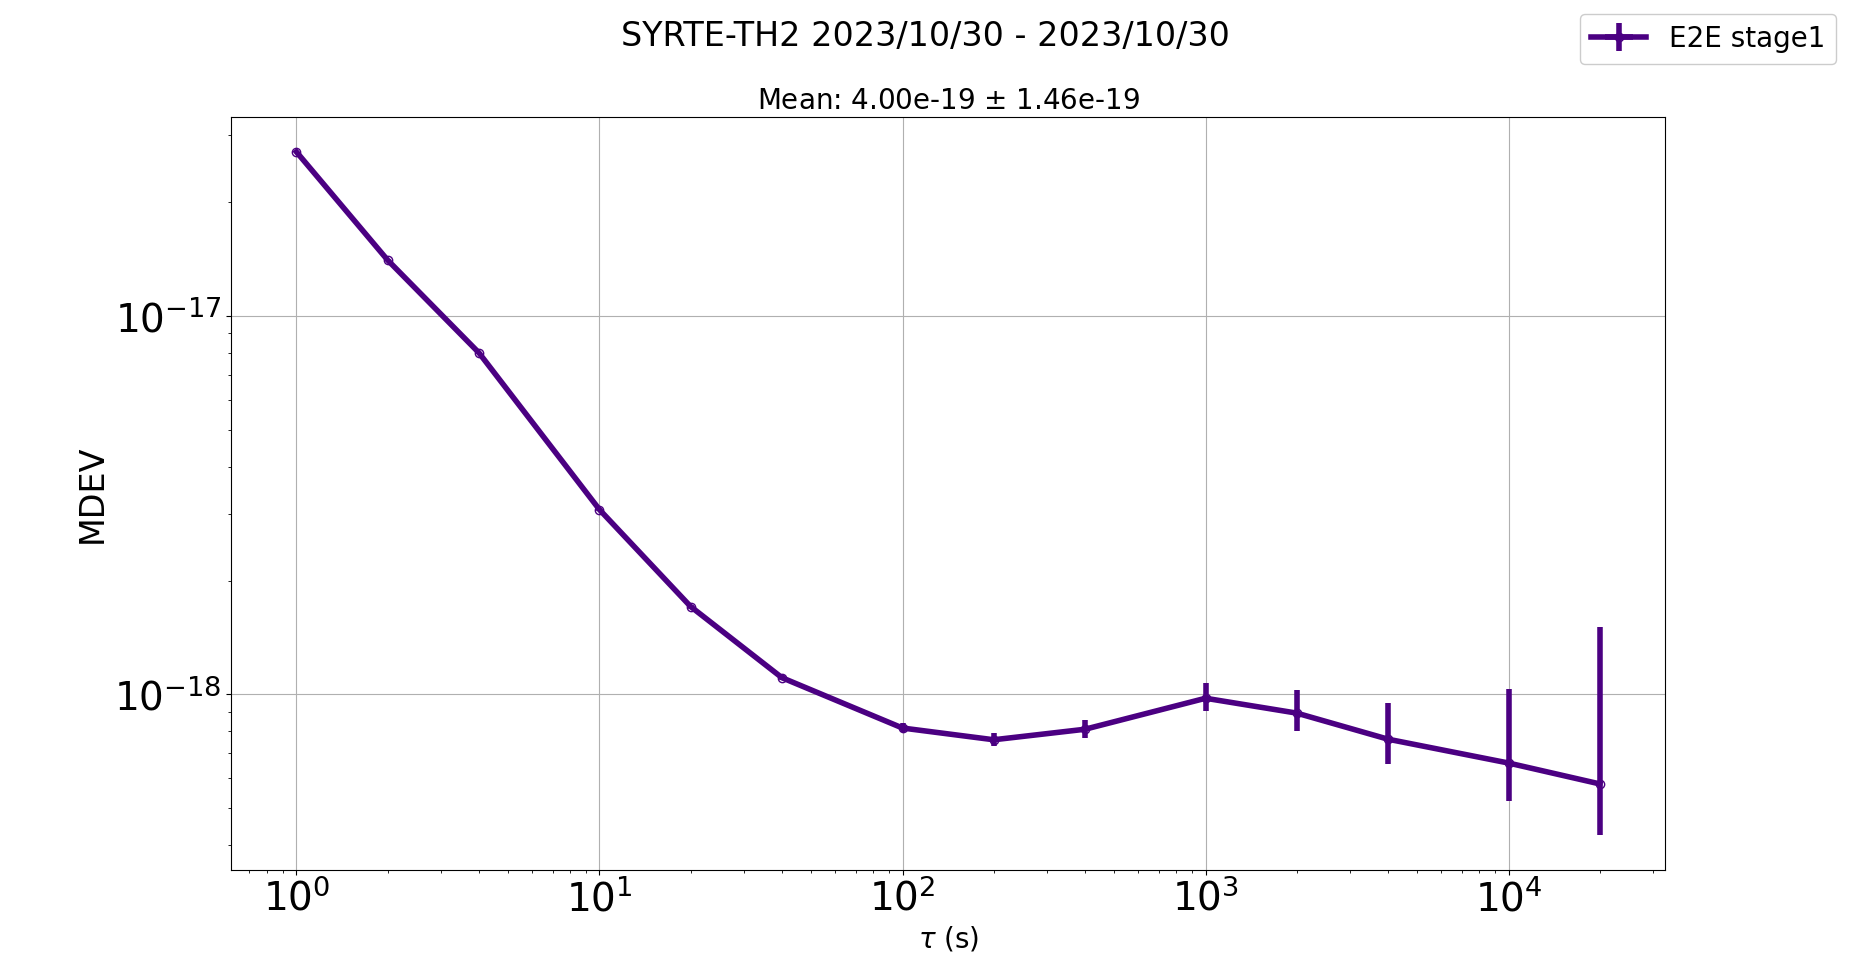
Using the plotDeviation()
Plot Allan deviation
>>> observable.plotDeviation(method="mdev", stageKey="stage1")
Using the plotPhase()
Plot Phase
>>> observable.plotPhase(stageKey="stage1")
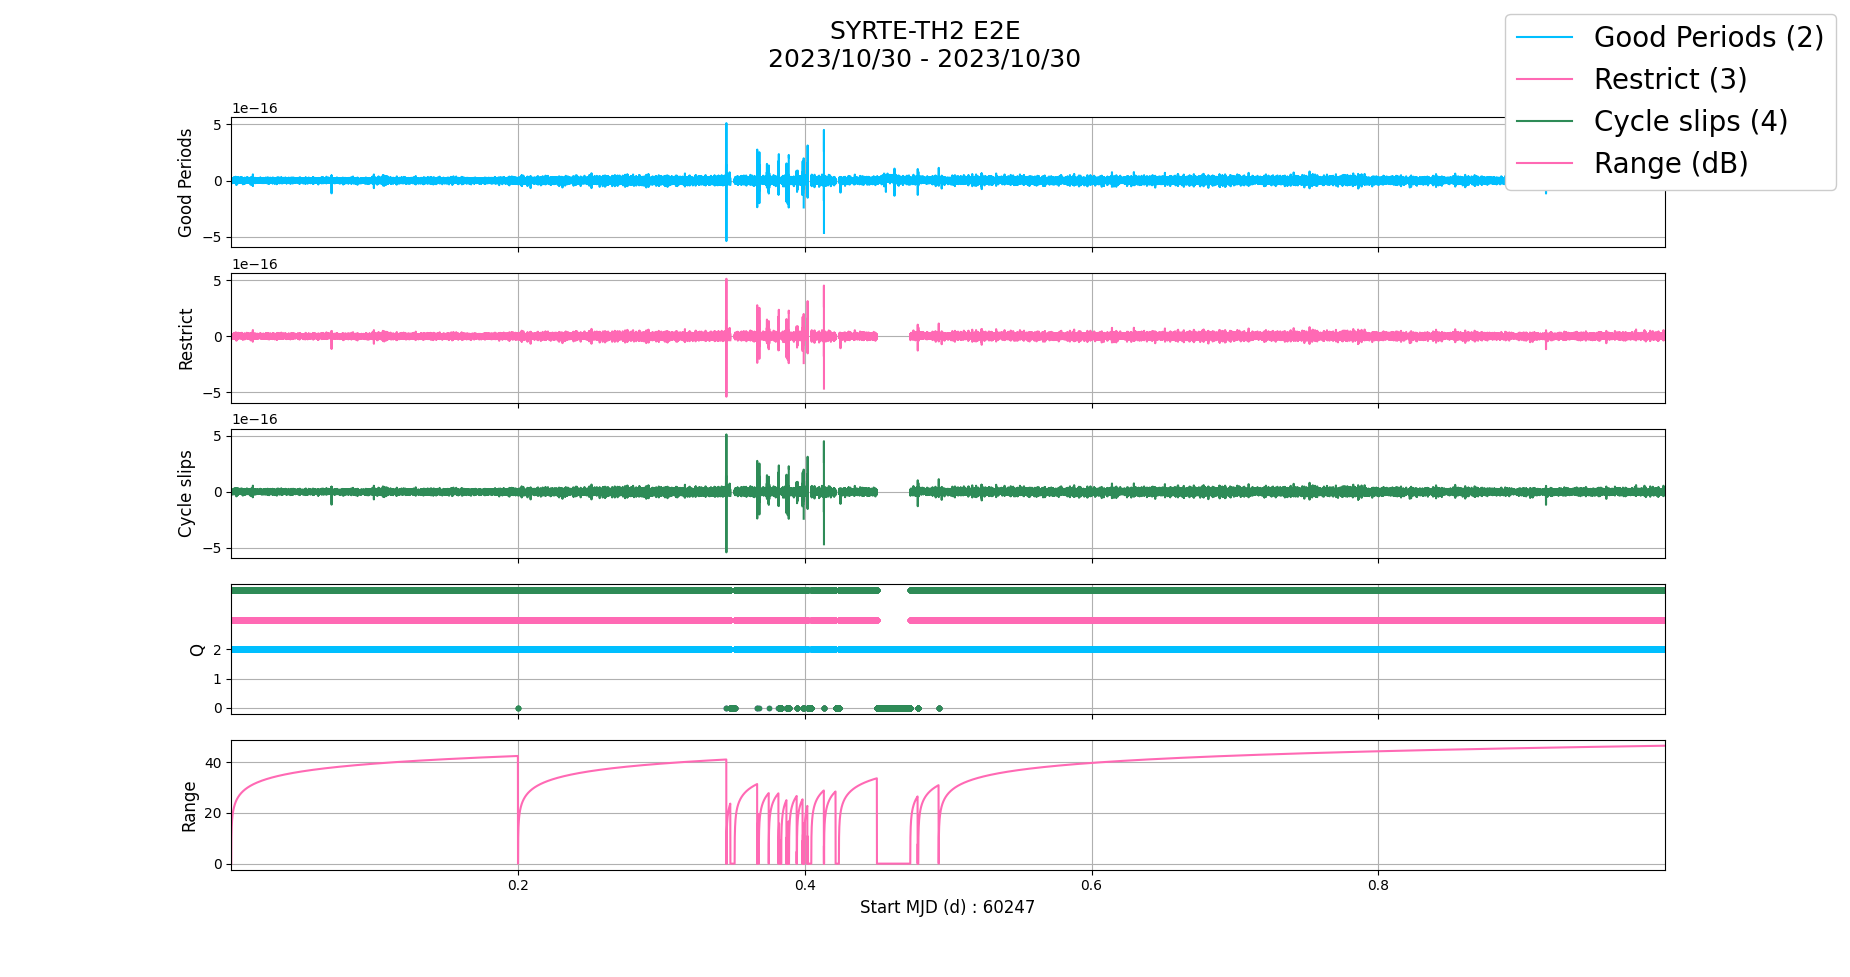
Using the plotQuickview()
Plot Quickview
>>> observable.plotQuickview(stages=[2,3,4])
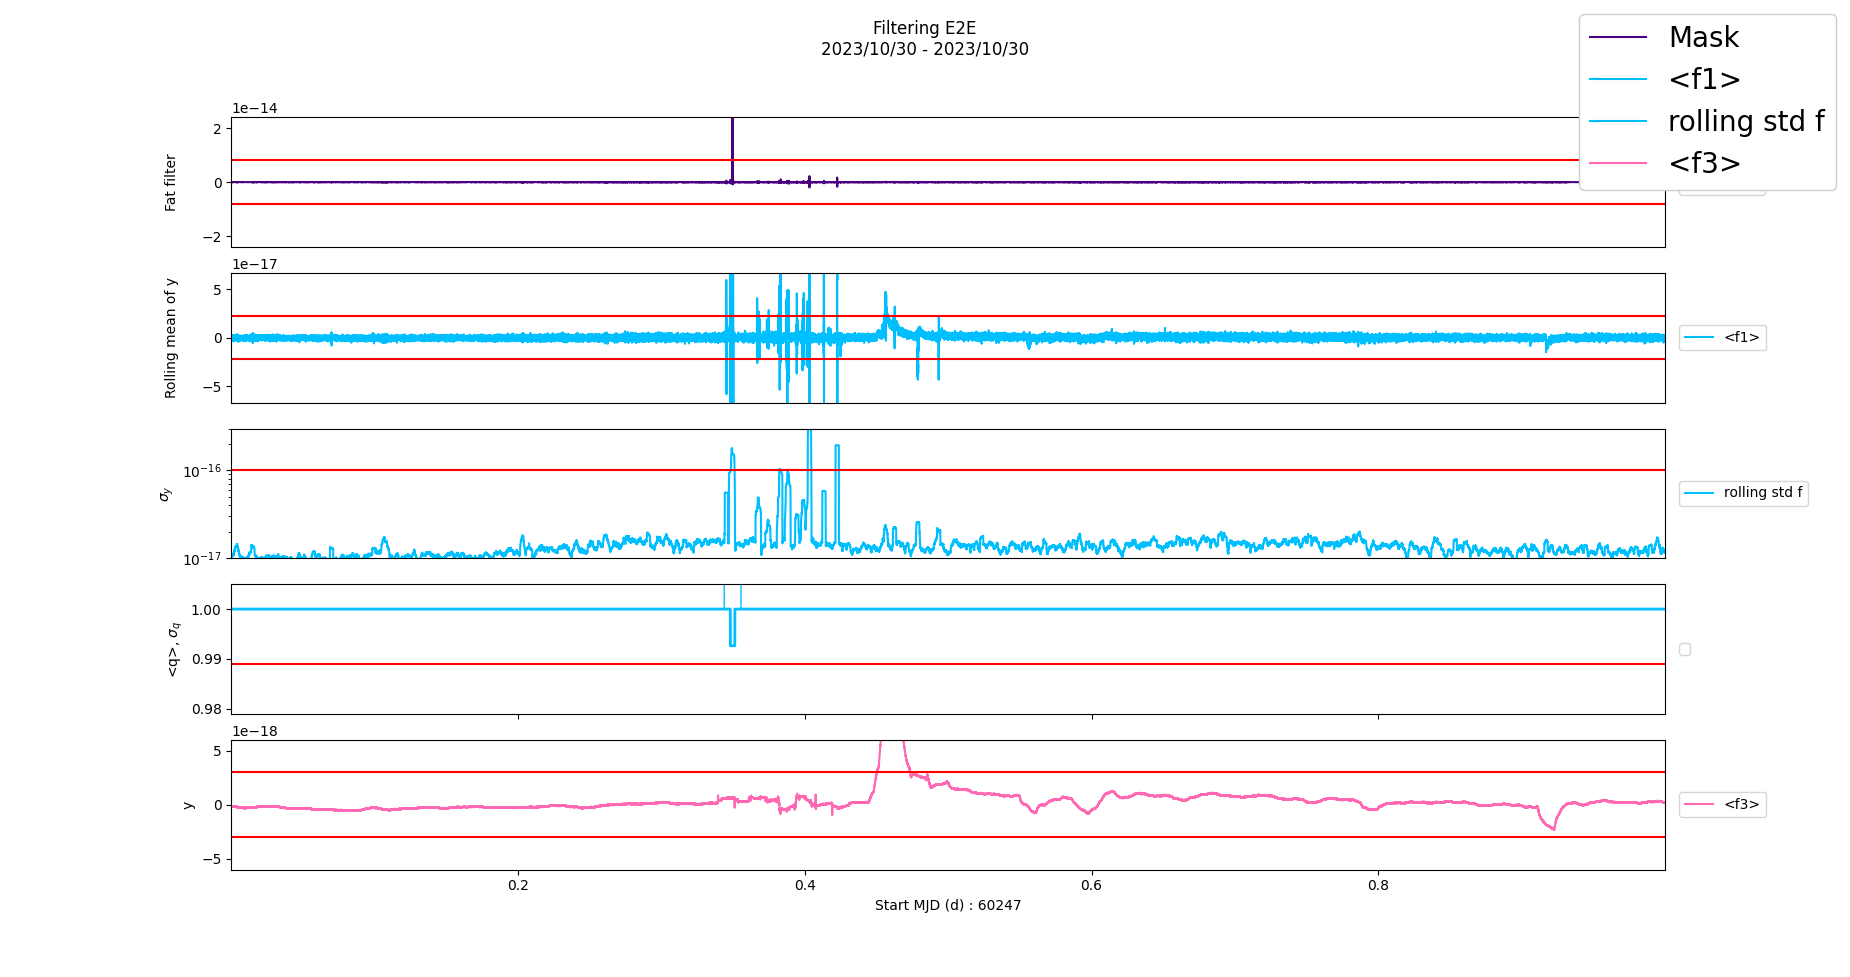
Using the plotFilters()
Plot filters
>>> observable.plotFilters(stages=[2,3,4])
Using the plotTemplatePage()
Plot template
>>> observable.plotTemplatePage(stageKey="stage1")
Using the plotAllTemplates()
Plot All Templates
>>> observable.plotAllTemplates()
Measuring Instrument timestamps drift
TODO
Clock comparison specific plots
Throughout this part of the tutorial, we will use a ClockComparison object of two Strontium clocks as follow :
>>> import palantir.clock_comparisons as clock_comparisons

>>> startDate = '230331'
>>> endDate = '230402'
>>> startTime = '000000'
>>> endTime = '000000'

>>> campaignID = 6
>>> CAMPAIGN_2023 = clock_comparisons.Campaign(campaignID, startDate, endDate, startTime, endTime, timezone='UTC')

>>> module0 = 184
>>> moduleN = 79

>>> PTB_Sr3_CombKnoten_NPL_Sr1 = CAMPAIGN_2023.processClockComparison(module0, moduleN, fetch_local=True)
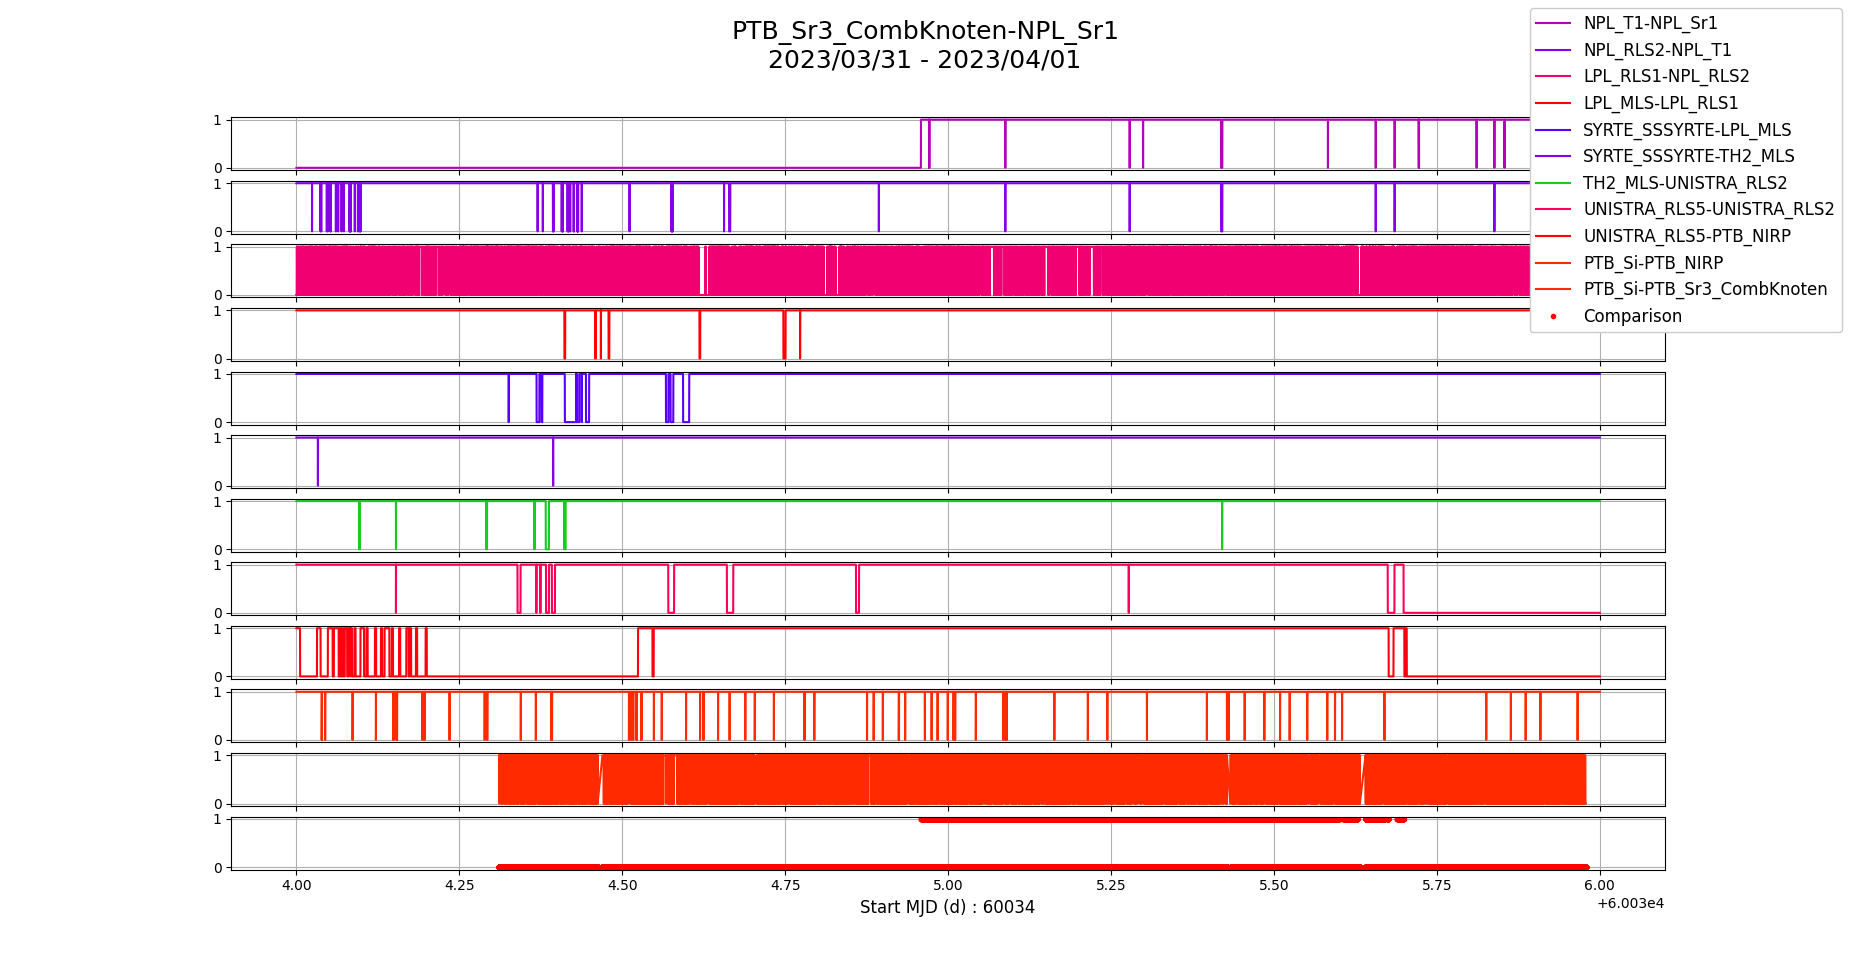
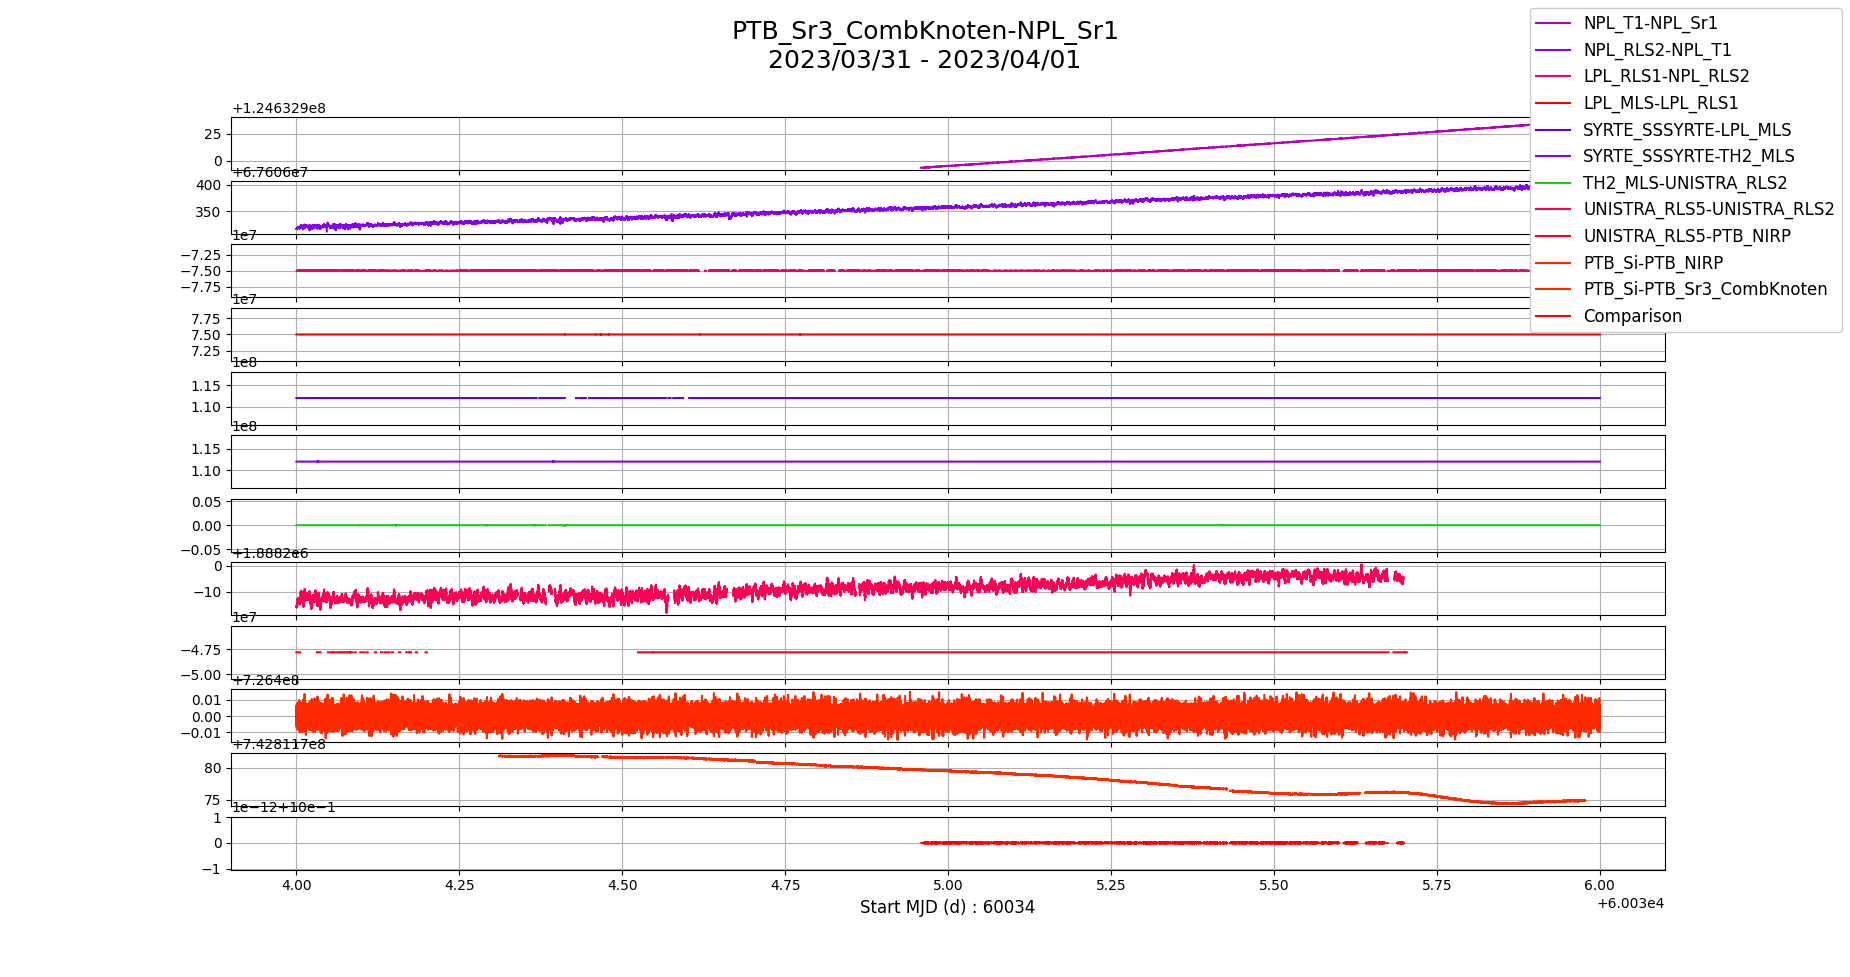
Plot all the comparators and the comparison in a single plot.
Plot the published frequencies
>>> PTB_Sr3_CombKnoten_NPL_Sr1.plotComparators()
Plot the quality factors
>>> PTB_Sr3_CombKnoten_NPL_Sr1.plotComparators(quality=True)